Treasury yield curve inversion and cycle model signal trouble for stock markets
The following chart shows the 10 year US treasury minus the 1 year treasury spread curve in blue. The current yield curve is negative which…
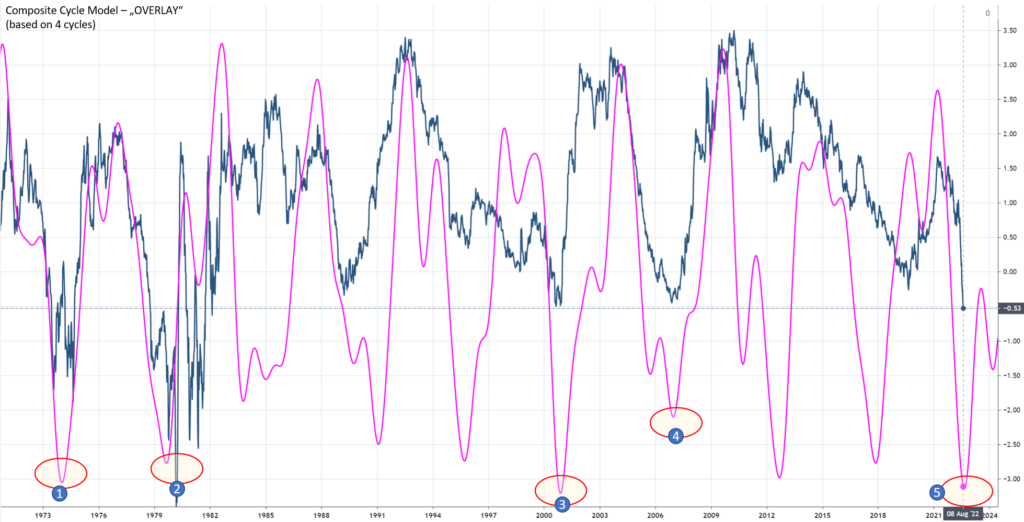
The following chart shows the 10 year US treasury minus the 1 year treasury spread curve in blue. The current yield curve is negative which…