• Home
  • Blog
  • Pricing
  • Home
  • Blog
  • Pricing

Shopping Cart

No products in the basket.

Sign in Sign up

Month: August 2022

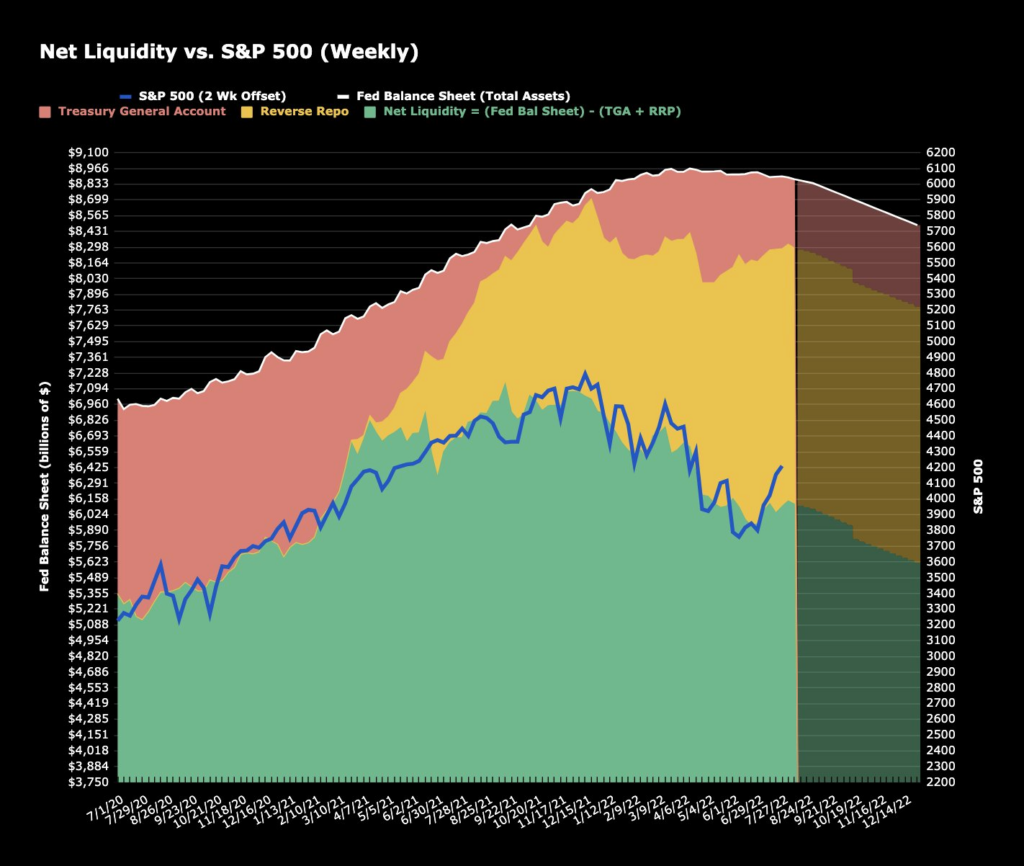
Can We Use Net Liquidity to Predict The Market?

A a metric based on a calculation of Net Liquidity suggests that the SPX is now over 300 Points “Over Valued” which represents the largest…

miker
Mike Richards 13 August 2022

Treasury yield curve inversion and cycle model signal trouble for stock markets

The following chart shows the 10 year US treasury minus the 1 year treasury spread curve in blue. The current yield curve is negative which…

miker
Mike Richards 11 August 2022

Have Stocks & Bond Markets Seen The Lows for This Year?

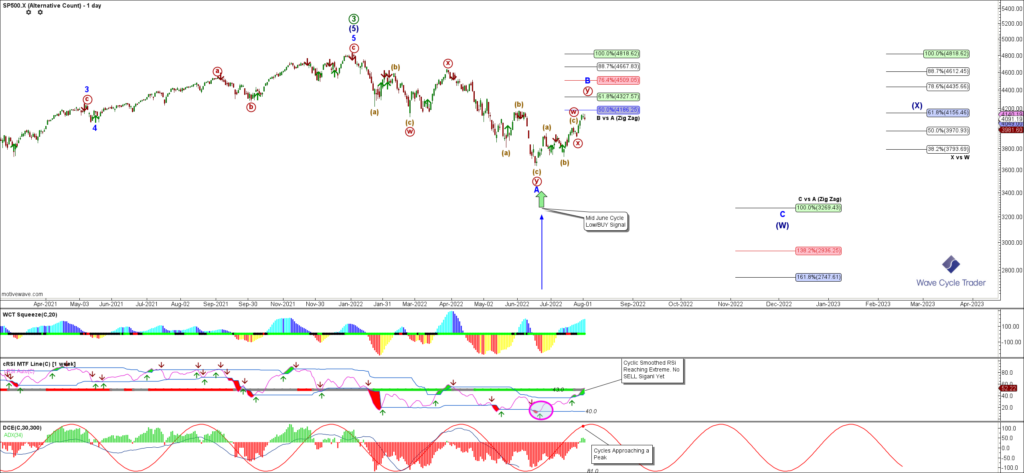
In short, NO! We’ve seen US Stock Indices rally strongly higher off the Mid June 2022 lows in tandem with US Bonds. The conditions were…

miker
Mike Richards 3 August 2022

Recent Posts

  • New Youtube Video: NVDA Correcting Lower Before Earnings #trading #howtoearnmoneyfromusstockmarket #nvda #trading
  • New Youtube Video: PLTR Review #trading #howtoearnmoneyfromusstockmarket #pltr #stockmarket #trader #daytrading
  • New Youtube Video: SBET Update #trading #howtoearnmoneyfromusstockmarket #forex #crypto #crypto #ethereum
  • New Youtube Video: BTC Still has more Upside #trading #howtoearnmoneyfromusstockmarket #forex #cryptocurrency #bitcoin
  • New Youtube Video: BitCoin Still has more Upside #trading #howtoearnmoneyfromusstockmarket #forex #crypto #bitcoin

Categories

  • Blog
  • Bonds & Yields
  • Daily
  • Sectors & Stocks
  • Trading Vision
  • Uncategorised
  • Youtube

© Copyright TradingVision 2025.  All Rights Reserved.  Privacy Policy.  Terms of Service.

Facebook-f Instagram Youtube Linkedin Twitter