
Summary
- This too will pass, and now is the time to remain completely calm, identify opportunity, and form a plan.
- We were early in our forecast, but the larger time frame charts we have posted on numerous occasions are finally following through.
- While this correction appears swift, from a time perspective it’s not nearly over, but from a price perspective we are closer to the bottom than the top.
There’s not a single investor who is not asking themselves how far this market can drop, and when will things stabilize and begin to move back in a positive direction? Allow me to assure you that markets will stabilize, and it won’t be long in the coming. That notwithstanding, this correction is most likely not over, and there will be more wild swings, spikes in volatility, and general pain for many to endure before it does complete. But it will pass, and the primary question you should be asking yourself right now is at what point will you make a decision? In relation to markets, the decisions are relatively simple – when do I exit, when to I enter, or when do I hedge? In respect to exiting or hedging, at least its initial destination for that train left the station weeks ago, and has most likely already arrived. However, all is not lost, as you may have another opportunity to hedge. All in all though, by far the most important question you should be asking yourself right now is at what price level do you enter positions? As you will see in my following discussion, this is precisely the moment to remain calm, and to prepare your list of stocks you want to add as long term core capital holdings.
I’ve spent considerable time reading many of the authors of articles, and it always amazes me at how they claim to have forewarned of an almost imminent drop in the markets. Well, allow me to add ourselves to this dubious crowd as well. Quite admittedly though, unlike many who provide their Elliott Wave and Fibonnaci expectations, we won’t deny being wrong when it occurs, as the importance of remaining completely objective and adjusting to market conditions at all times is the only way to effectively manage capital over the long term. For us though, it’s a classic case of being right, but being early. Throughout most of 2019 I warned of an impending correction to the S&P 500. Going back to July 31, 2019, when I presented our primary analysis suggestive of a 25% correction in my article here on TradingVision entitled U.S. Equity Markets’ Forthcoming 25% Correction, when the S&P 500 was at 3,000, we strongly suggested a pullback would occur into the 2,300 region. Now, with the benefit of hindsight, we know that the SPX continued to climb an additional 400 points from when this article was published. Does this mean we were wrong? Well, perhaps in a manner of speaking. However, the larger time frame Elliott Wave count continues to play out in an almost picture perfect fashion. I have to say, though, that the climb in the SPX that occurred from the 2018 low has never sat well with us. We were never able to comfortably fib out an impulsive wave structure, and since ultimately price always prevails, we ultimately and reluctantly accepted the possibility it had bottomed in 2018, all the time feeling as though there was some unusual nuance to the overall EW count that we were not seeing. We consistently made reference to this throughout 2019. This move down has now cleared up much of the questions that existed during this last period of price action. I also will say that we and our investors at this point in time are comfortably in cash. Investors rarely view cash as a position, but right now it’s an excellent position to be in, as it allows one to remain fully objective at all times, and focus on entries for the next major leg up with some precision. Ideally you would have exited stocks from higher levels that now. If you didn’t, however, please pay close attention to the potential for a larger b-wave bounce to occur, which might offer an excellent opportunity to hedge for another rather large final drop that would virtually mimic the first half of the corrective game.
The move up from the 2018 low did hit a 1.0 extension. This means, in Fibonacci terms, that there were two connecting wave structures that were equal in size. This can be a number of things, but in our view this correction didn’t start from 3400, it actually began forming a complex WXY pattern in early October 2018. A WXY pattern differs from an ABC in that it consists of two three wave patterns (W and Y) that are connected by an X wave that is often times also a 3-wave move. Please refer to the S&P 500 Weekly Chart below. The initial 3-wave move down that occurred into late 2018 was the W. Following this pullback we saw a 3-wave X-wave that took out the prior high. Herein lies the rub, and why throughout most of 2019 we were expecting a simple ABC down to the 2300-2200 region. However instead SPX provide a much larger abc structure into the 3400 region to form an expanded flat X-wave. Quite often expanded flats will provide a move to the next Fibonacci level in the sequence, and in this case that Fibonacci level was the 1.618, again, as shown on the weekly chart below.
S&P 500 Weekly Chart
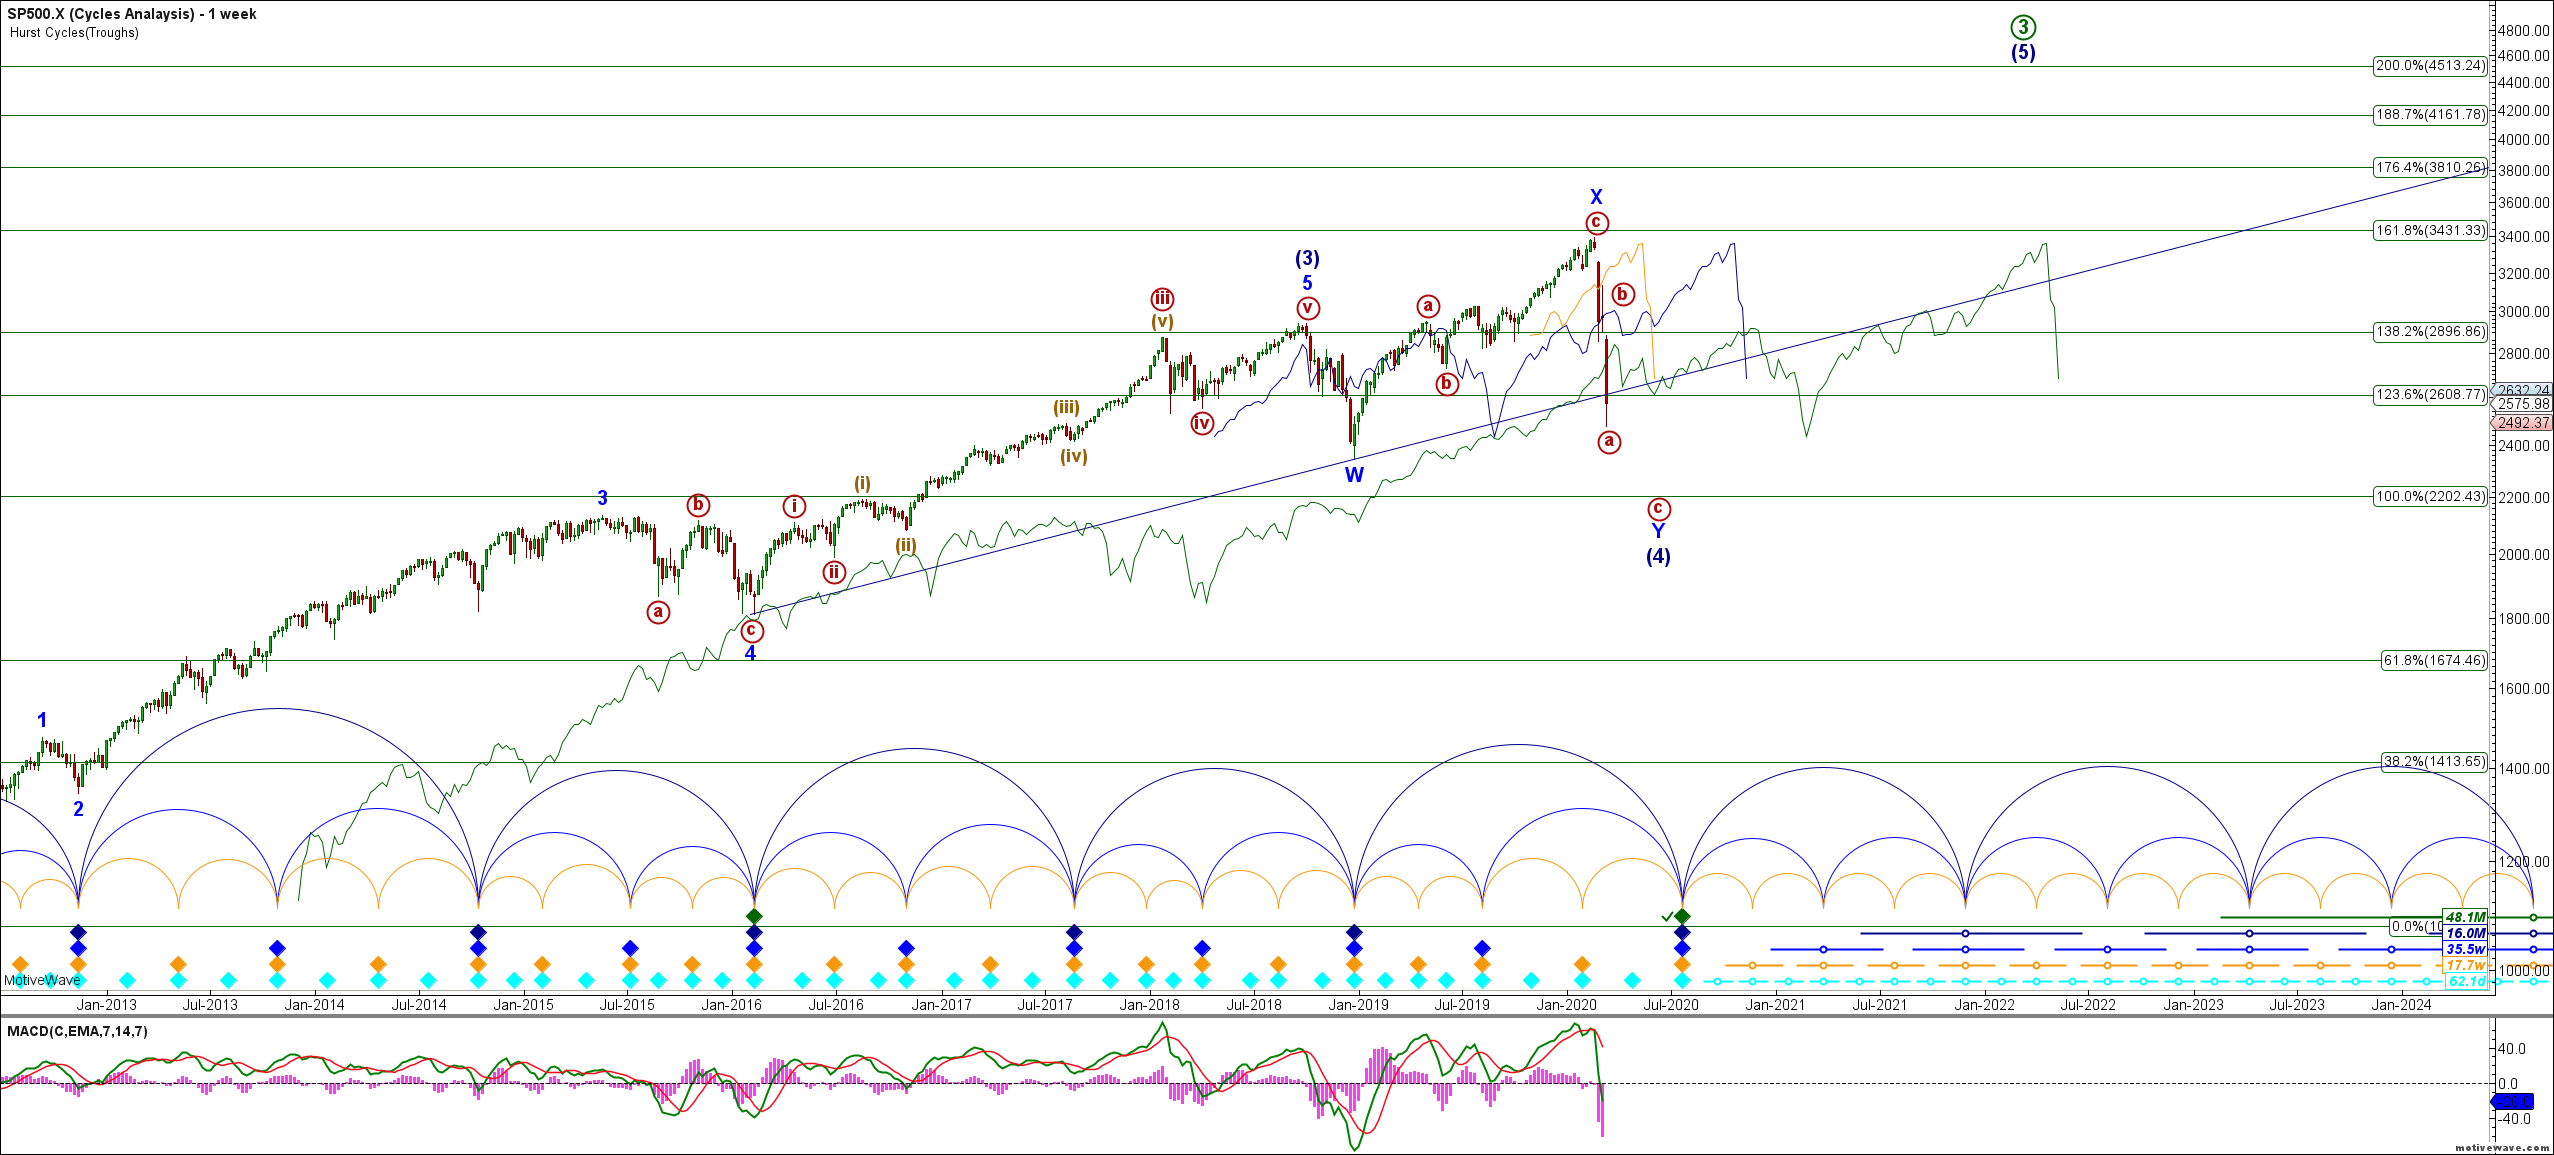
Viewing the S&P 500 in a larger complex WXY pattern would now suggest that the move down into the target region would take the form of a large 3-wave move, the Y wave. Markets are moving rather swiftly, so depending on market action early this week will provide clues as to whether this primary count continues to play out or not. There are several alternative ways to view markets, but as of now we continue to view this as a larger complex WXY, which would mean a rather large bounce will occur into the 2890-3010 region, to then be followed by another 3-wave move down to the 2200 region. It’s of course possible it completes a larger impulse to the downside that would complete this correction rather quickly. In either count, the downside targets are similar, although please note that there’s an outside potential this correction targets the lower price level of 1850. We will watch for clues to support this potential, but until it confirms an impulse, diagonal down, or provides a higher retrace that takes the form of an abc structure, as we are expecting. In the meantime, remain patient and calm, and go to work in preparing a list of core stocks you want to purchase, and then become familiar with the price level targets for each well advance of it occurring. When markets ultimately do capitulate to complete this correction, you do not want to be wondering what to do, but rather plan for it well in advance. Not everything will play out picture perfect, but having a reasonable plan well in advance will allow you to put on positions early, and add throughout a confirming move back to the upside.
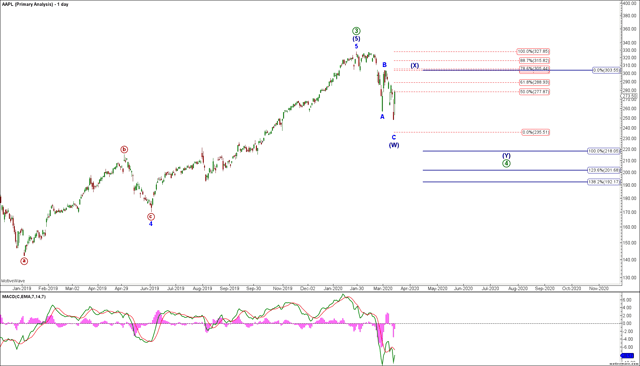
To illustrate what I mean, allow me to walk you through a few examples. Firstly, let’s take a look at Apple (NASDAQ:AAPL). I have not included the weekly chart for AAPL, but our price forecast for the next major leg up in AAPL is $566. So now, we are focused solely on getting into a position in AAPL at a very reasonable price level, and then getting ourselves to safety as swiftly as possible with a reasonable stop out level. Everything is about risk relative to reward in positioning capital. AAPL looks to have completed its W wave of (4), similar to the indices, and is now it’s the X wave. This would suggest that anyone owning a large position in AAPL may have the opportunity to hedge this position by buying some puts in the region of the X-wave, and for anyone who is seeking to acquire shares of AAPL as a core holding, to focus on the region of $218. We will adjust the entry level to real time pricing on the final move down, but at this moment this is a general idea of our price level expectations for AAPL.
Apple, Inc. Daily Chart
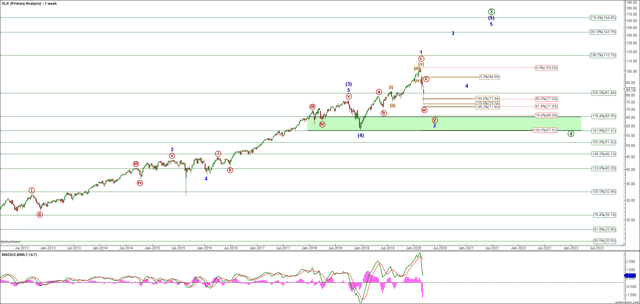
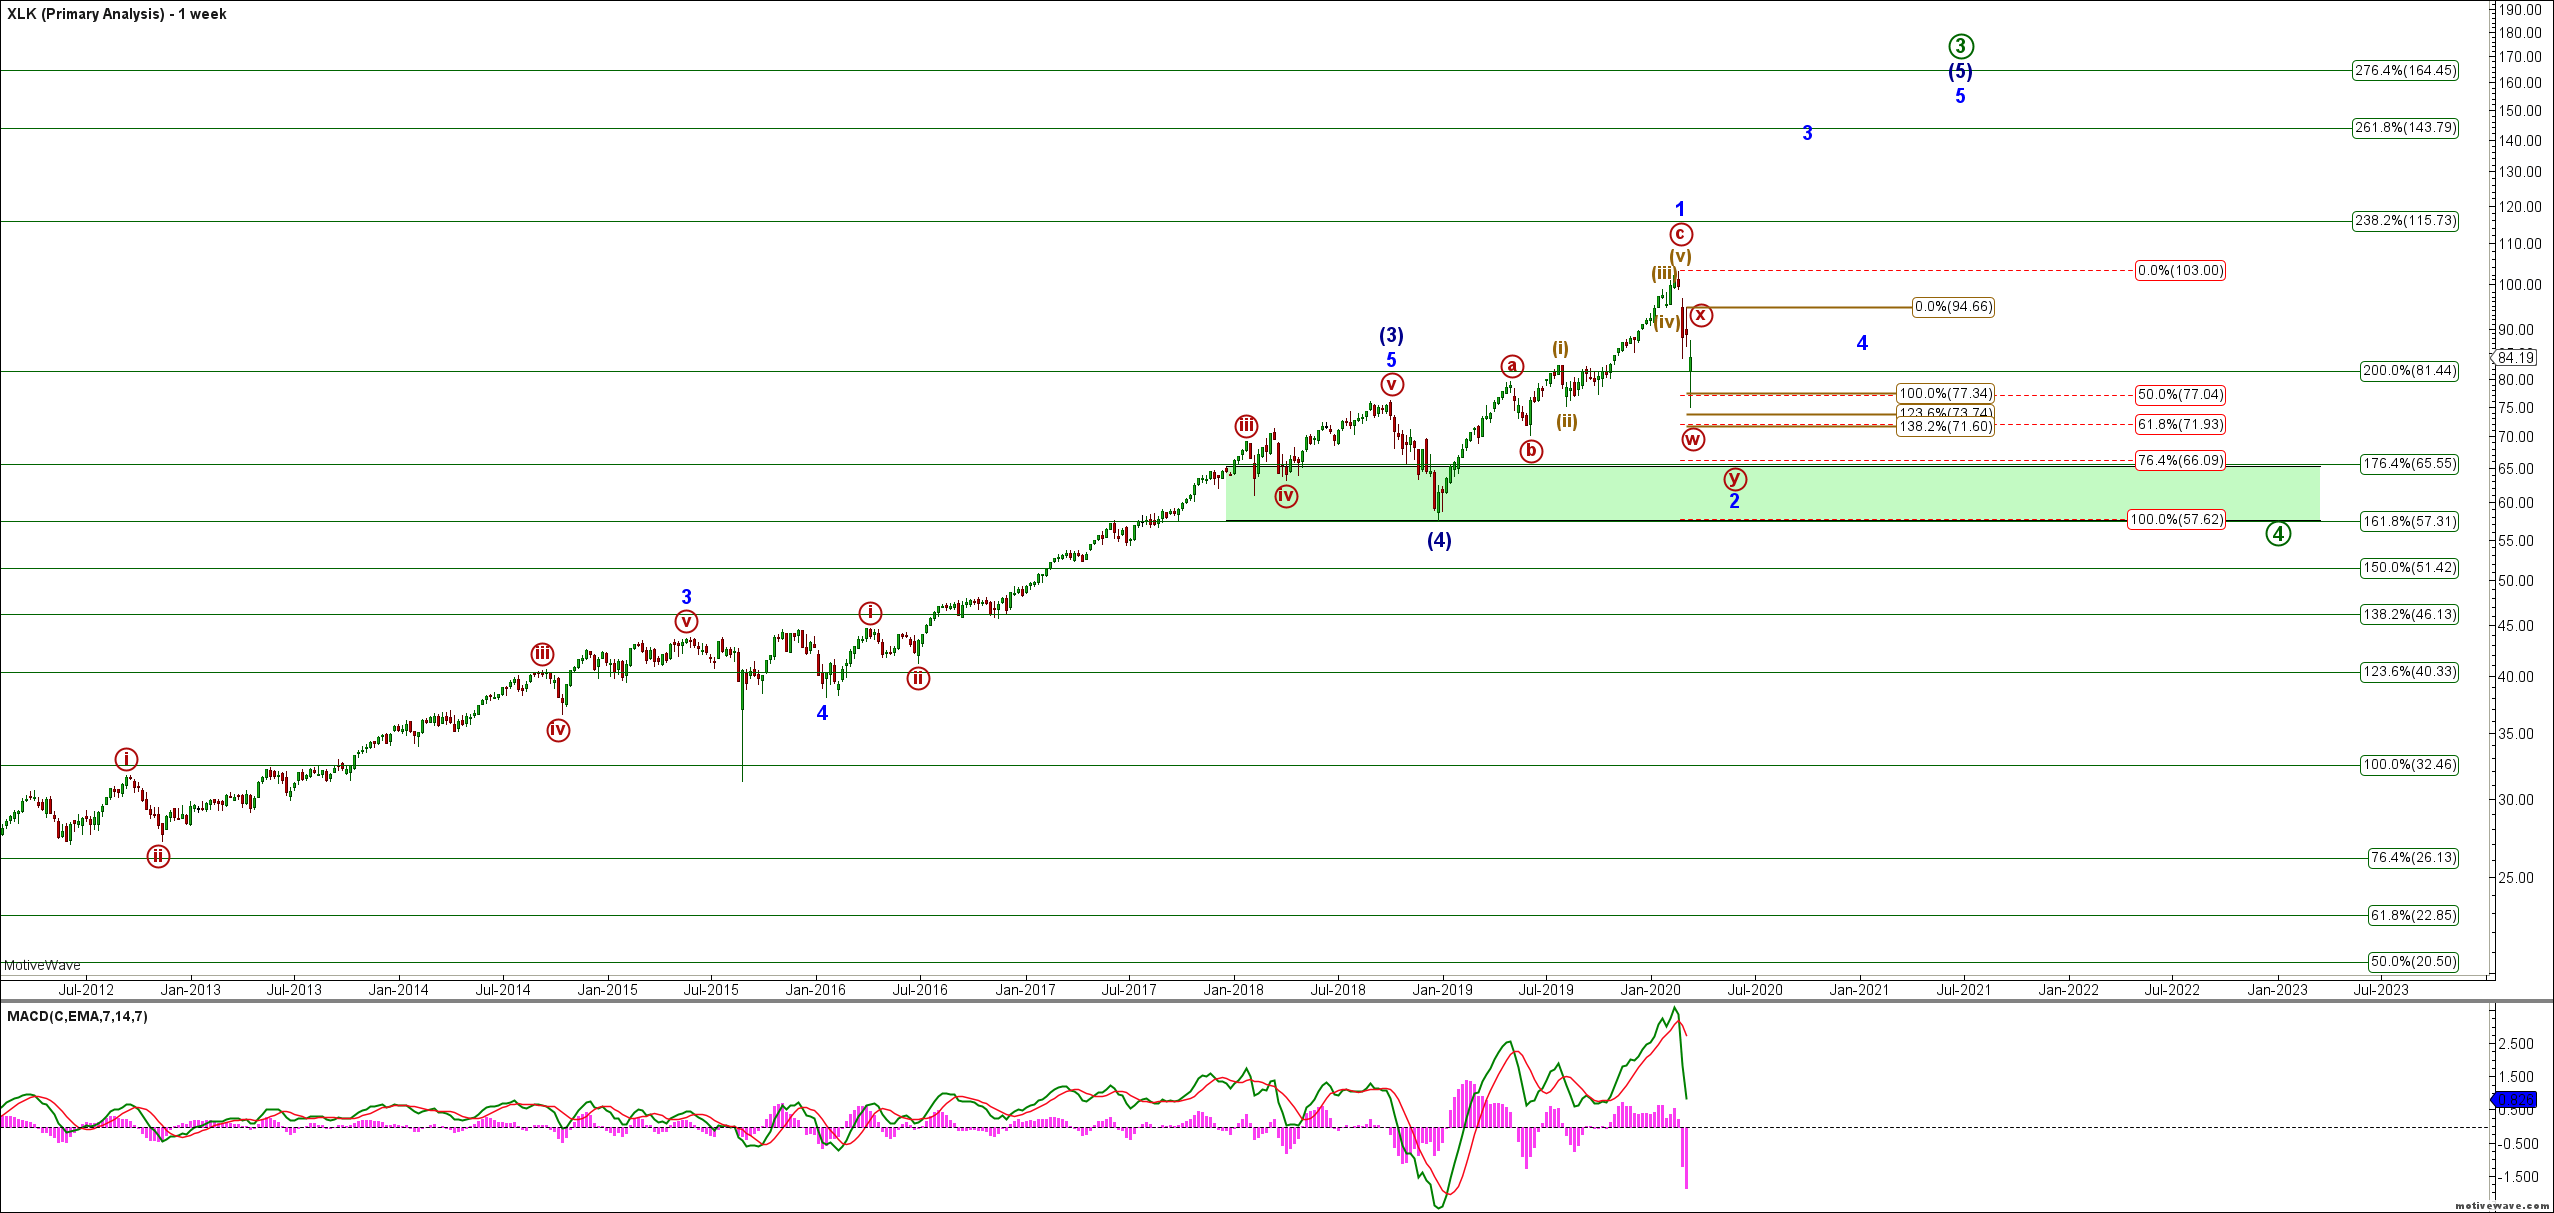
Now turn your attention to Technology Select Sector SPDR Fund (SYM:XLK). Again, similar to AAPL and the indices, we are viewing XLK as forming a WXY pattern off the high. However, the big variation in XLK vs. the indices is that we are viewing this move down as a wave 2 in a large ending diagonal wave (3) off the 2009 now. The area shaded in green represents that larger time frame support for the XLK. In other words, XLK has shown relative strength in this correction, and it’s wave 4 of (3) may already be completed.
Technology Select Sector SPDR Fund – XLK Weekly Chart
In closing, there’s not much we can add to what we reiterated repeatedly throughout 2019, other than to say that we do not view this correction as having completed. Is it possible it bottomed last week? Certainly it’s possible, insomuch as anything is possible. However, we don’t view it having bottomed as an elevated probability. While at this time I won’t opine on all the various reasons, allow me to simply say that based on the price action, and pattern, we would expect markets to complete this correction as early as late May, and as late as the July time frame.
Again, remain calm, identify opportunities, and try not to formulate too strong a bias based on all the news we are all taking in right now. This is a time to identify stocks you have wanted to own for some time, and to position yourself to greatly enhance your overall capital performance over the coming years.


